[Case 01]
25% Growth in Checkout Completion
E-Commerce
A Flyer that you actually take home!
Boosting Conversion Rates for E-commerce Checkout
[Project Overview]
[Industry]
E-Commerce
[My Role]
Lead Designer
[Platforms]
Desktop and Android
[Timeline]
January 2024- March 2024
[Design Process]
[Outcome]
Stats show that up to 80% of flyers are discarded immediately
30% reduction in cart abandonment on mobile devices.
30% reduction in cart abandonment on mobile devices.
"How might we reimagine a flyer to make it engaging, useful, and memorable—while raising awareness about something invisible?"
[Persona]
Jhon Roberts
Marketing Manager
Age: 29
Location: New York City
Tech Proficiency: Moderate
Gender: Male
[Goal]
Quickly complete purchases without interruptions.
Access accurate product details and a seamless payment process.
Trust the platform with his payment and personal information.
[Frustrations]
Quickly complete purchases without interruptions.
Access accurate product details and a seamless payment process.
Trust the platform with his payment and personal information.
Let's talk about the flyer first
[Research & Key Insights]
In a digital world, physical media often gets overlooked. But with the right value, it can last.
Our research showed:
Flyers are discarded unless they offer utility or novelty.
Adding elements like a discount code, calendar, or puzzle increases retention.
Our unique value? The interactive AR story – a digital “coupon” for curiosity.
To work, the flyer had to delight, not just inform. It needed to be visually striking, instantly engaging, and tangibly useful.
[Design Process]
Interactive folds: Explored creative formats like accordion, gatefolds, and pop-ups.
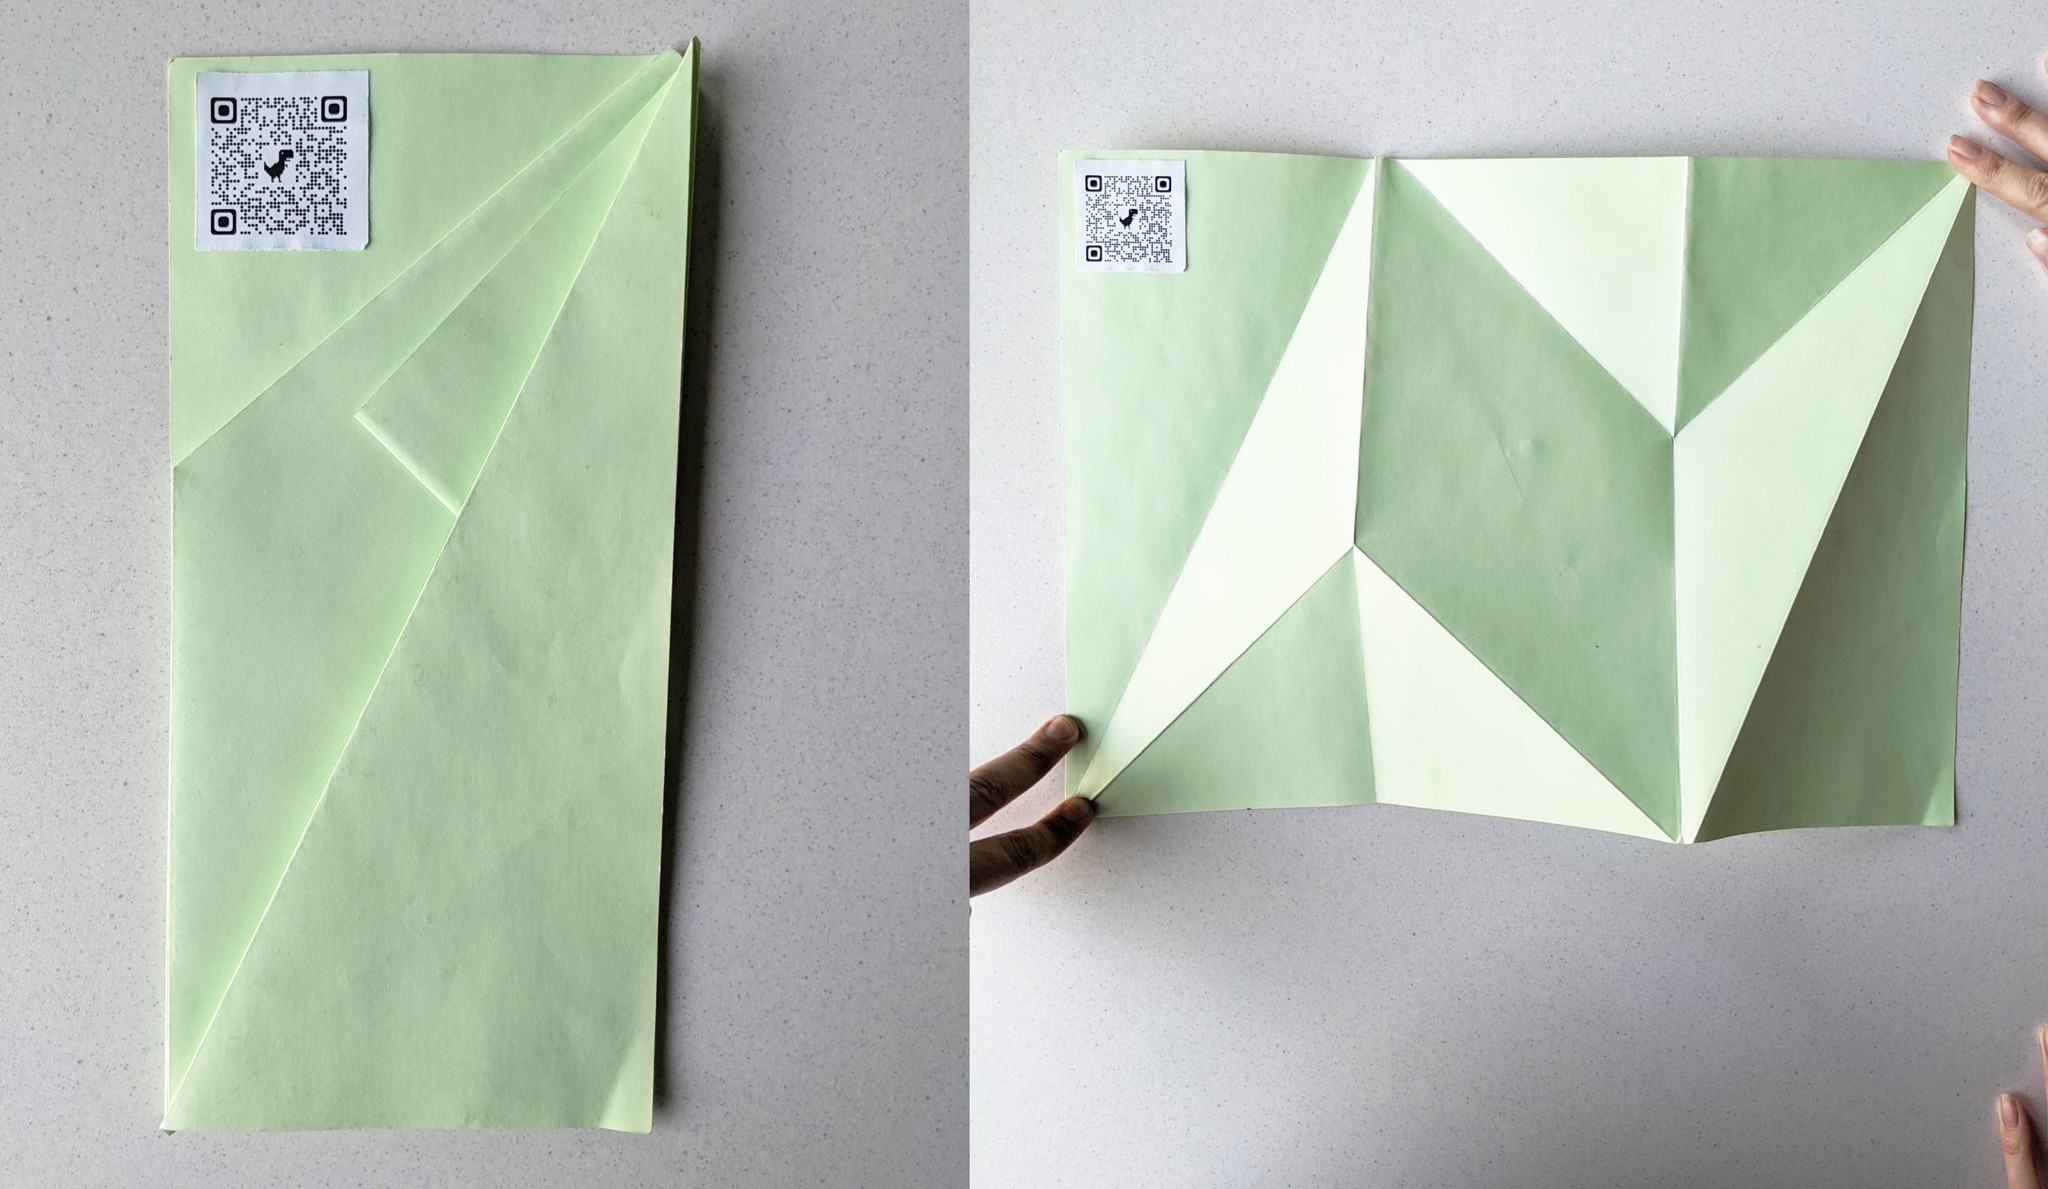
Planning how the story progresses and how the viewer's gaze travels across it.


We explored different ways to create a followable journey—one followed a path, the other mimicked a comic strip. The comic-inspired version won, as it not only guided the narrative effectively but also worked seamlessly with the flyer’s folds.


[User Testing & Validation]
We tested our flyer with 10 testers. Results:
Once the flyers and a working AR prototype were ready, we tested them with 10 users—fellow students and passersby at a campus event. The results were encouraging. Unlike most flyers that get a quick glance and tossed away, ours were immediately opened. People smiled, some laughed. One said, “This doesn’t look like an ad, it looks fun!”
On average, users spent 1–2 minutes exploring the flyer, much more than a typical leaflet. Most remembered key takeaways—like the fact we might be ingesting a credit card’s worth of plastic each week.
Value & keepsake factor:
At the end of testing, 8 out of 10 kept the flyer
And Voila!


Journey of the App now!
[Research & Key Insights]
We found that AR campaigns hold attention much longer—averaging around 75 seconds of interaction, compared to the few seconds typical flyers get. This reinforced that AR could significantly deepen engagement.
Another key insight: ease of access is everything. If the AR experience felt clunky or required too many steps, users would likely drop off. Many successful AR campaigns used simple QR codes to launch content instantly, so we decided to make our entry frictionless—scan the flyer to open or download the AR experience in seconds.
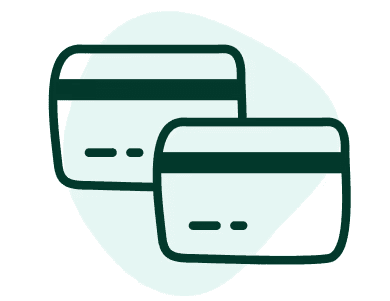
We also gathered compelling microplastic facts to build our story. A standout was that humans ingest about 5g of plastic per week—roughly the weight of a credit card. This vivid metaphor became a cornerstone of our narrative and resonated strongly with test audiences.

This is how the app interacts with the flyer: as you scan a section, it presents you with options and shows different results based on your choices.

[Ideation & Process]
In parallel with the flyer, we brainstormed how the mobile app would complement the print experience.
Story Extension in AR
We mapped each flyer panel to an AR scene. For example in a scene where we are taking about the brush we add screen in the app which hits us to "oh I need to brush my teeth!", this gives users a story to follow and keep them engaged in the app


Gamification & Feedback
We introduced the idea of an “impact score”—a fun, quiz-like feature after all AR scenes were viewed. Users would answer simple questions (e.g., "How many plastic bottles do you use weekly?") and receive a result like:
“You consumed X credit cards of plastic last week!”
Design for Behavior Change: Encourage action through positive feedback and personal relevance.
Playful Storytelling: Deliver heavy messages in a light, digestible way.
[Brand Design]

[Final Product]

Now check for yourself how much microplastic you consumed last week:p

[Key Learnings]
Human-Centered Approach
Designing experiences that prioritize user needs and behaviors.
Human-Centered Approach
Designing experiences that prioritize user needs and behaviors.
Human-Centered Approach
Designing experiences that prioritize user needs and behaviors.